Water Level Analysis
Reservoir storage at Talbingo is near full capacity. Standing at an impressive 97.9%, the total volume sits at 921 GL. This near-full status guarantees strong water availability for local communities and agriculture.
Catchment & Hydrological Impact
The Tumut River acts as the primary lifeblood for Talbingo, making it a cornerstone of the Murray-Darling Basin network. Hydrological health in this specific drainage basin is vital for downstream ecosystems. Catchment dynamics in the Murray-Darling Basin are deeply influenced by the retention capacity of Talbingo.
Agricultural & Economic Significance
Agriculture in the surrounding areas of New South Wales depends heavily on the water security provided by Talbingo. Irrigation allocations are directly tied to these storage metrics. Sustainable water management here ensures that both crops and livestock can survive prolonged dry spells.
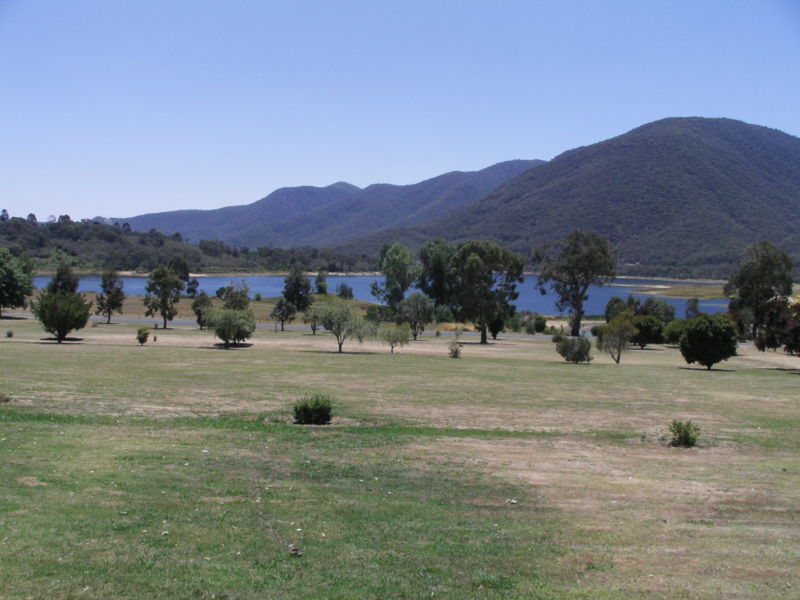
Ecological & Recreational Context
Ecologically, the reservoir and its immediate wetlands serve as a crucial habitat for native Australian wildlife. During periods of healthy water levels, the area often sees an increase in recreational activities such as fishing, boating, and camping. Authorities must constantly balance the need for human water consumption with the ecological necessity of maintaining healthy river systems downstream.
Current Weather & Evaporation Impact
Cooler current temperatures of 12°C help minimize evaporation losses across the reservoir. Under current partly cloudy weather, there is no direct rainfall contributing to the immediate storage levels.
Future Outlook & Monitoring
The Bureau of Meteorology's climate outlooks will play a pivotal role in predicting the future inflows for this catchment. State water authorities utilize highly sophisticated monitoring tools to ensure every drop is accounted for. Resilience against extreme weather events remains the ultimate goal for the managers of this critical infrastructure.